Most Australian businesses collect plenty of safety, quality and environmental records, yet QHSE data analysis rarely happens. Incident reports sit in one folder. Audit findings sit in another. Inspection checklists pile up in a supervisor’s ute. Nobody joins the dots, so the same problems keep returning.
Collecting data is monitoring. Analysing it is what turns monitoring into decisions. That step is where an integrated management system earns its keep.
What the standards require you to analyse
ISO 9001:2015 Clause 9.1.3 requires you to analyse and evaluate appropriate data from monitoring and measurement. The results must show conformity, customer satisfaction, system performance and whether planning worked. They must also show how well actions on risks and opportunities performed, how external providers performed, and where improvement is needed.
ISO 14001:2015 Clause 9.1.1 and ISO 45001:2018 Clause 9.1.1 add a further test. You must decide what to monitor, which methods you will use, and when the results will be analysed and evaluated. You must also keep documented information as evidence. All three standards share the Annex SL structure, so one QHSE data analysis cycle can serve quality, safety and environment together.
The law points the same way. Section 19(3)(g) of the Work Health and Safety Act 2011 requires a person conducting a business or undertaking to ensure the health of workers and the conditions at the workplace are monitored to prevent illness or injury. Monitoring that nobody analyses rarely prevents anything.
Why QHSE data analysis fails in practice
Three patterns appear in almost every business. The first is lagging-only data. Injury counts and complaints tell you what already went wrong. They say little about what is about to go wrong.
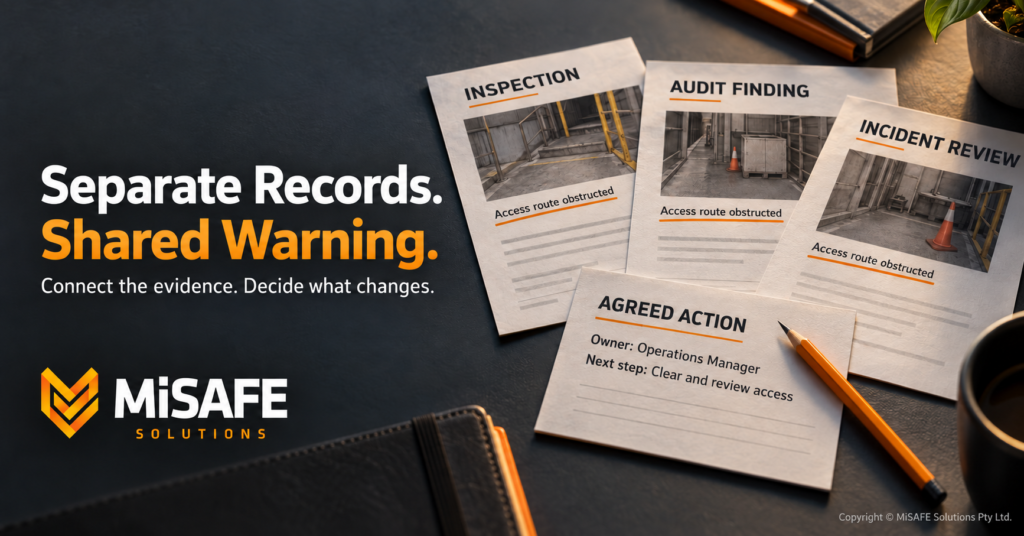
The second is siloed data. Incidents live in a register, audits in a report and supplier issues in an email inbox. Because nothing links them, a recurring cause never shows up as a pattern.
The third is analysis without a decision. Someone builds a chart, the meeting nods, and nothing changes. Clause 10.3 of ISO 45001 and Clause 10.3 of ISO 9001 both expect continual improvement. Evidence of a decision is the proof that improvement happened.
A simple method to turn data into insights
Start with a question, not a spreadsheet. Ask what you need to know, for example whether plant and pedestrian interactions are getting worse. Then pull every relevant record from one place.
Before you analyse anything, check the quality of the data. Incomplete incident reports, inconsistent site names and missing dates will distort every trend. Agree a short set of fields and categories first. Then train supervisors to use them the same way every time.
Next, separate lead indicators from lag indicators. Lead indicators include hazard reports, near misses, inspection completion and training currency. Lag indicators include lost time injuries, nonconformities and complaints. A healthy picture needs both, because a rising near miss count is an early warning that a quiet injury record can hide.
Then look for patterns across five lenses: trend over time, location, task, time of day and contractor or supplier. Use counts and rolling twelve-month views for small teams. Frequency rates per million hours worked swing wildly when headcount is low, so treat them with care. AS/NZS ISO 31000:2018 Clause 6.6 on monitoring and review supports this approach, because it asks you to feed what you learn back into risk treatment.
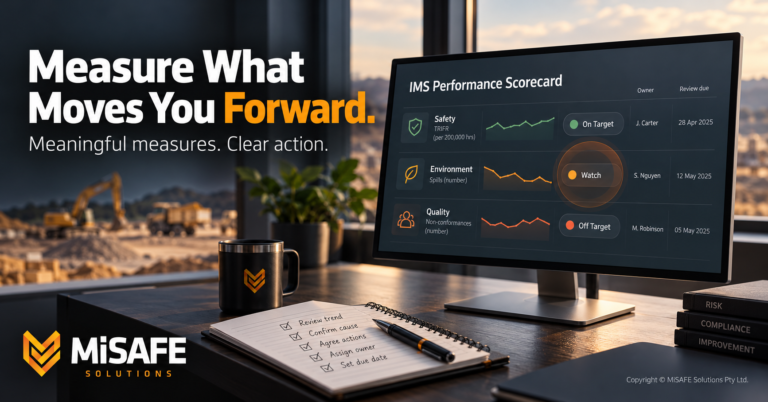
Finally, convert each insight into a decision. Every finding needs an owner, an action and a due date. If it needs none of those, log a decision to take no action and move on. This is the discipline that makes QHSE data analysis worth the time.
Set a review cadence and make it visible
Different data needs different rhythms. Hazard reports suit a weekly look. Incident and inspection trends suit a monthly review. Supplier performance and audit findings suit a quarterly view. Legal compliance evaluation under ISO 14001 and ISO 45001 Clause 9.1.2 suits at least an annual check.
List every data source in one register with an owner, a frequency and a next-due date. When the next-due date passes without an analysis, the register should flag it automatically. That single habit stops analysis from quietly lapsing when the business gets busy.
Practical Application
Consider an Australian civil contractor with 25 staff working across multiple sites. The QHSE Manager lists eight data sources: incidents and near misses, hazard reports, site inspections, internal audit findings, training currency, customer complaints, subcontractor performance and environmental monitoring. Each gets an owner, a frequency and a next-due date.
On the first Tuesday of each month, the Operations Manager and QHSE Manager spend sixty minutes on the register. They filter near misses by site, task and time of day. The review shows that most near misses involve plant and pedestrian interaction at two sites, mostly late in the afternoon.
The decision is clear and immediate. They set up exclusion zones, add a spotter requirement after 2 pm and revise the site traffic management plan. The result goes to the next toolbox talk and into the Management Review under ISO 9001 Clause 9.3.2, ISO 14001 Clause 9.3 and ISO 45001 Clause 9.3. That cycle is QHSE data analysis doing its job.
Importantly, the review also checks the data itself. The team notices that two sites record near misses far less often than the others. That is not good news. It suggests under-reporting, so they add a reporting reminder and a simple QR code feedback link to both site offices.
Conclusion
Data does not improve safety, quality or environmental performance on its own. Decisions do. A single register, a clear cadence and a habit of converting every insight into an owned action turn routine records into a genuine management tool, and give you evidence that stands up at audit.
The MiSAFE All-in-One QHSE subscription includes configuration of your data analysis register and dashboards inside DS Site, with automatic due-date flags, trend views and Management Review summaries.
Ready to act? Contact us today or book a free 45-minute consultation.
Download the Free Template
Download the free QHSE Data Analysis Register (.xlsx) and start turning every data source into a scheduled analysis, a clear insight and an owned action.
This article is general guidance. Check the legislation that applies in your state, or talk to us about your situation.